MenthorQ Gamma Levels: How They Are Built and Used
MenthorQ gamma levels explained: net gamma exposure by strike, futures levels from the four CME chains, the full contract list, 0DTE walls and Blind Spot Levels.
Overview
Almost every charting platform can draw support and resistance. Very few can tell you where the people who have to hedge are standing. That is the gap MenthorQ gamma levels are built to fill: instead of inferring zones from past price, they are calculated from options positioning and open interest, so the line on your chart corresponds to a place where someone is obliged to act.
This guide explains how the levels are produced, which markets they cover, what each label on the chart means and where they plot. Every detail comes from the model pages MenthorQ publishes itself, and you can open the same pages from the MenthorQ model library while you read.
What MenthorQ gamma levels actually are
MenthorQ describes them directly: gamma levels are “market reaction zones identified through market positioning and open interest data”. By analysing the options chain, the platform pinpoints the strikes carrying significant positive or negative gamma, and calls the result “sticky price levels” — prices that tend to attract and hold the market because of the hedging that happens around them.
The distinction matters. A trend line is a drawing. A gamma level is a measurement of where dealer exposure concentrates, which is why the same level can behave like support on one day and like a magnet on the next. MenthorQ frames the output as three uses: market insight into dealer exposure, risk management through knowing where shifts can occur, and a data-driven way to place entries and exits.
Net Gamma Exposure: the calculation behind every level
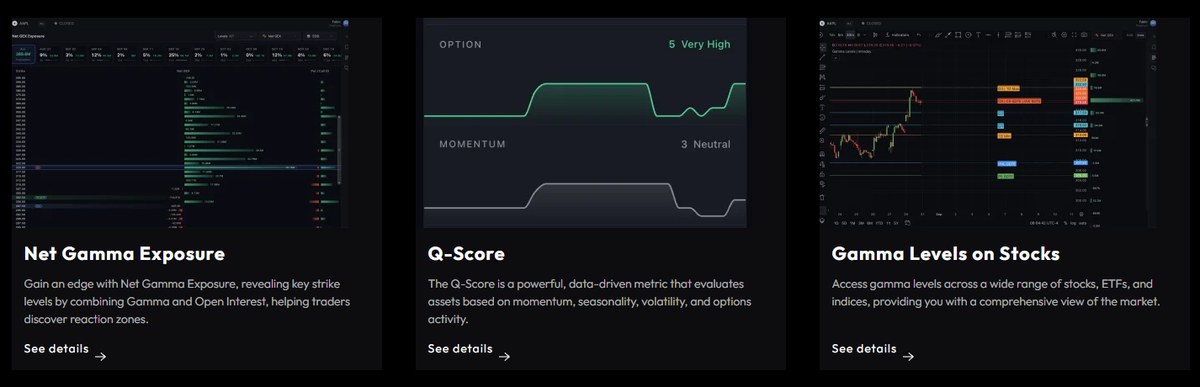
Net Gamma Exposure is the engine. MenthorQ takes gamma and open interest for calls and puts and produces net gamma exposure by strike. The strikes carrying the highest positive or negative exposure are the ones promoted to levels, because they are where market makers hold the most delta sensitivity and therefore where hedging flow is most likely to show up.
Read in that order, the chain makes sense: open interest says how much is held at each strike, gamma says how fast the hedge changes as price moves, and the combination of the two says which strikes can act as support or resistance. MenthorQ calls these the key reaction zones, and the whole level set on your chart is an expression of that one table.
Why futures gamma levels are calculated differently
This is the part that separates MenthorQ gamma levels from most retail alternatives. Futures levels are not mapped across from equity options. MenthorQ states that they are calculated using direct options chains coming from the four CME exchanges — CME, NYMEX, CBOT and COMEX.
For an ES or CL trader that is the whole argument. A level derived from SPY options and transposed onto ES is an approximation of positioning in a different instrument with a different holder base. A level calculated from the ES options chain itself is a measurement of positioning in the contract you are actually trading.
Which contracts MenthorQ gamma levels cover
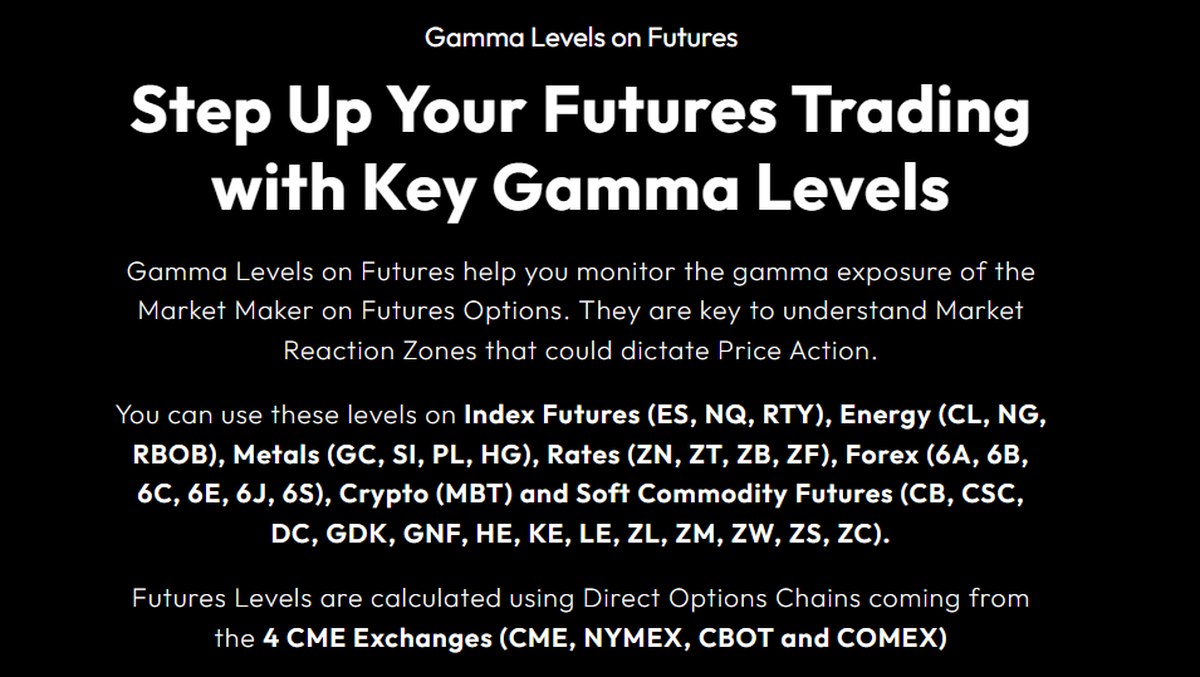
The published coverage list is specific enough to check against your own instrument list before you subscribe:
| Market | Contracts |
|---|---|
| Index futures | ES (S&P 500), NQ (Nasdaq), RTY (Russell 2000) |
| Energy | CL (crude oil), NG (natural gas), RBOB (gasoline) |
| Metals | GC (gold), SI (silver), PL (platinum), HG (copper) |
| Rates | ZN, ZT, ZB, ZF |
| Forex futures | 6A, 6B, 6C, 6E, 6J, 6S |
| Crypto | MBT |
| Soft commodities | CB, CSC, DC, GDK, GNF, HE, KE, LE, ZL, ZM, ZW, ZS, ZC |
On the equity side the same model runs across stocks, ETFs and indices, and MenthorQ publishes a dedicated view for SPX, QQQ and VIX on the grounds that those three together cover broad sentiment, the technology sector and expected volatility.
Reading the labels on the chart
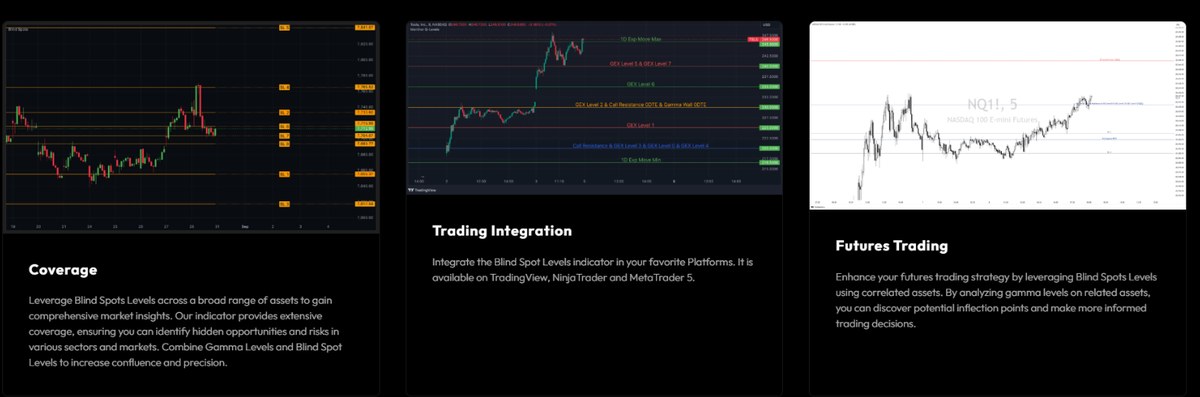
The levels arrive named rather than as anonymous lines, which is what makes them usable intraday. The labels you will see include:
- Call Resistance — the strike above price with the heaviest call gamma, where hedging tends to cap advances.
- Put Support — the mirror image below price.
- HVL (High Volatility Level) — the gamma flip point; MenthorQ describes it as reflecting actual market-maker positioning rather than an approximation.
- Gamma Wall 0DTE — the dominant same-day expiry concentration.
- GEX Level 1 to 7 — the ranked secondary strikes by net gamma exposure.
- 1D Exp Move Max / Min — the expected daily range implied by current volatility.
Used together they give a session a shape before the open: a ceiling, a floor, a flip point and an expected range. That is a different kind of preparation from drawing yesterday’s high and low.
0DTE levels and expiry days
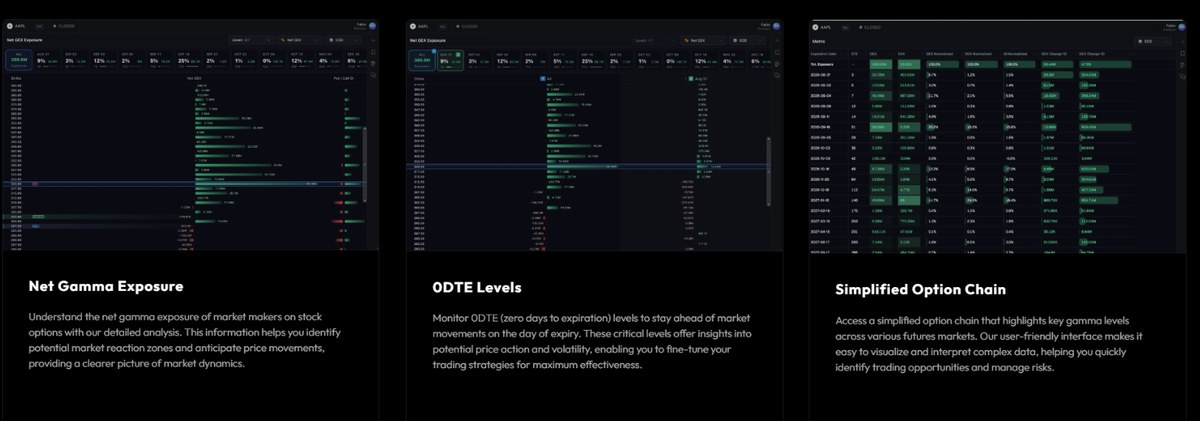
Zero-days-to-expiration options concentrate gamma into a single session, and MenthorQ publishes a separate 0DTE view for exactly that reason: to “monitor 0DTE levels to stay ahead of market movements on the day of expiry”. On an expiry day the same-day chain can dominate the level set entirely, which is why the Gamma Wall 0DTE label exists alongside the standard levels.
The practical habit this encourages is simple. Check whether the level you are trading against is coming from the 0DTE chain or from longer-dated open interest, because the first one disappears at the close and the second one does not.
Blind Spot Levels: gamma on the assets you are not watching
The Blind Spot Levels Indicator is the most distinctive thing around the core model. Rather than reading the gamma of the instrument on screen, it reads key gamma levels on correlated assets and surfaces inflection points that would not appear on the chart in front of you.
MenthorQ positions it as covering overlooked risk — areas where sentiment and positioning may shift before your own instrument reacts — and recommends combining it with the standard gamma levels “to increase confluence and precision”. For a futures trader that means watching where the index complex is pinned while trading a correlated contract.
From option chain to level: the simplified chain
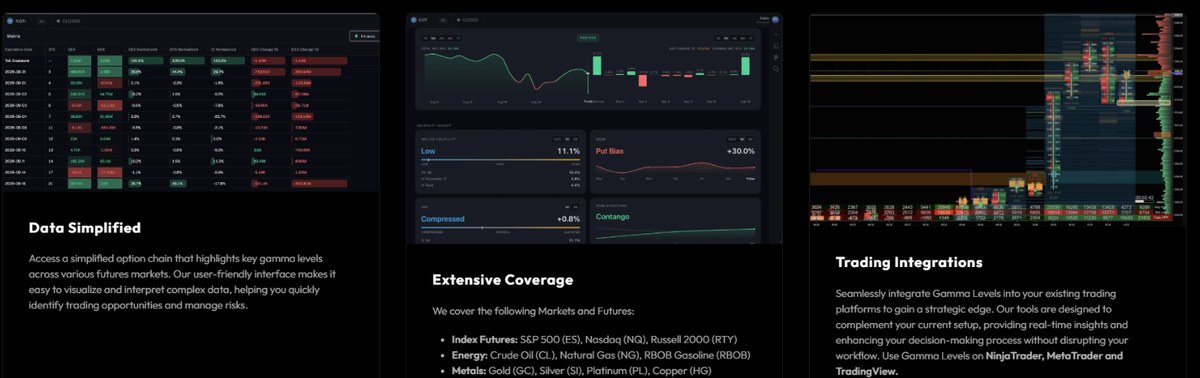
If you want to audit a level rather than take it on trust, the simplified option chain is where to do it. MenthorQ describes it as a chain that “highlights key gamma levels across various futures markets”, laid out so the underlying numbers stay visible: expiration date, days to expiry, GEX, normalised GEX and the change in GEX over recent sessions.
That transparency is the quiet argument for the product. A level you can trace back to a strike and an exposure figure is one you can decide to ignore on a day when the chain looks thin.
Where MenthorQ gamma levels plot
The levels are designed to appear inside the platform you already trade on rather than in a separate window. MenthorQ lists ten native integrations on its homepage — TradingView, NinjaTrader, TrendSpider, ATAS, Quantower, Bookmap, Sierra Chart, MotiveWave, EdgeClear and Tickblaze — and notes that the indicators come with the Premium and Pro memberships.
Worth flagging for accuracy: the individual model pages name a slightly different set. The Gamma Levels on Stocks page says the levels can be used on “NinjaTrader, Quantower, ATAS, Bookmap, Sierra Chart, MetaTrader and TradingView”, and the Blind Spot Levels page says that indicator is “available on TradingView, NinjaTrader and MetaTrader 5” — MetaTrader appears on both, but not in the ten-platform list on the homepage. If MetaTrader is the platform you need, confirm it with MenthorQ support before subscribing rather than assuming either page is the current one.
Who MenthorQ gamma levels suit
- Intraday futures traders. Native CME chain calculation on ES, NQ, RTY, CL and GC is the single strongest reason to use this dataset.
- 0DTE and index options traders. The same-day view and the SPX, QQQ and VIX coverage are built for that session rhythm.
- Swing traders who want a map, not a signal. Call resistance, put support and the expected move frame a position without dictating one.
- Traders who already have a platform they like. The levels plot into it instead of replacing it.
- Anyone who wants to audit the inputs. The simplified chain shows the numbers the levels were built from.
If you trade purely on fundamentals and never look at options positioning, this dataset will not change your process. The free MenthorQ account shows the models on delayed data, so that question can be settled in an evening — you can open the free plan and compare the levels against your own instruments before paying anything.
Company information and regulatory status
The platform is operated by Menthor Q LLC, a Florida limited liability company, with the address published in its footer as 701 Brickell Key Blvd, 33131, Miami, Florida. It describes itself as a TradeTech firm building quantitative models with big data and artificial intelligence.
Its Terms of Use state the regulatory position without hedging, and it belongs in any honest write-up of the product: “Menthor Q LLC is not registered as an investment adviser with the U.S. Securities and Exchange Commission and does not offer personalized investment advice. All content, information, and materials provided via the Website, email, social media, or related channels are intended solely for educational and informational purposes.”
That is the right status for a data vendor. MenthorQ gamma levels are measurements, not recommendations; the company holds no client funds and places no trades. Readers who want to verify the registration position independently can search the adviser databases published by the U.S. Securities and Exchange Commission. The Terms note that some services may not be available in every location, and list no country-by-country restrictions.
Risk warning
MenthorQ publishes this in the footer of every page, reproduced here in full:
“Futures and forex trading contains substantial risk and is not for every investor. An investor could potentially lose all or more than the initial investment. Risk capital is money that can be lost without jeopardizing ones’ financial security or life style. Only risk capital should be used for trading and only those with sufficient risk capital should consider trading. Past performance is not necessarily indicative of future results.”
The warning applies with particular force to this kind of data. A gamma level describes where positioning is concentrated right now; it does not say price will stop there, and MenthorQ does not claim it will. Levels change as the chain changes, and a level that held all week can be irrelevant the morning after a large expiry.
The verdict
MenthorQ gamma levels are one of the few retail datasets where the methodology is both stated and checkable. Net gamma exposure by strike is a defined calculation, the futures levels come from the CME chains themselves rather than from a mapped proxy, the contract coverage is published contract by contract, and the simplified option chain lets you trace any line back to the exposure that produced it. The labels are named rather than numbered, so the output is usable from the first session instead of after a month of interpretation.
The caveats are the honest ones. The indicators sit behind the Premium and Pro plans, the platform list on the model pages does not quite match the homepage, and a gamma level is a map of positioning rather than a forecast. Used that way — as the frame for a session rather than a trade signal — it is a genuinely strong addition to a futures or options workflow. The free plan shows the models on delayed data, which is the sensible place to start with MenthorQ.
Overall: 4.5 / 5
Disclaimer
This guide to MenthorQ gamma levels is based on information published by MenthorQ on its own website in October 2026 and is provided for informational purposes only. It is not investment advice and not a recommendation to trade any instrument. Model coverage, platform availability and plan contents can change at any time — always check the MenthorQ website for current details before subscribing. This page contains affiliate links; if you subscribe through them we may receive a commission at no additional cost to you.